Population (Mid-2014) : 4, 755, 234
• Density (people per sq. km) : 93
• Net Migration Rate (# per 1000 people) : 0.84
• Birth Rate (# per 1000 people) : 16.08
• Death Rate (# per 1000 people): 4.49
• Rate of Natural Increase : 1.1%
• Population Growth Rate : 1.24 %
• Infant Mortality Rate (# of deaths per 1000 live births) : 8.7
• Total Fertility Rate (average # of children per woman) : 1.91
• Population Age <15 % : 24%
• Population Ages 65+ %: 7%
• Dependency Rate (add together Population Age <15 % and Ages 65+ %) : 31%
• Life Expectancy at Birth (total) : 80
• Life Expectancy at Birth Females : 82
• Life Expectancy at Birth Males : 77
• Primary School Completion Rate Females : 97%
• Primary School Completion Rate Males : 95%
• Secondary School Enrollment Net Females : n/a
• Secondary School Enrollment Net Males : n/a
• GNI PPP per capita in US$ : $13, 570
• Economically Active Females 15+ : 45%
• Economically Active Males 15+ : 80%
• Mobile Phone Subscribers (# per 100) : 146
• Motor Vehicles (# per 1000) : 188
• Undernourished Population:
• Underweight Children Under Age 5: 1.1
• HIV/AIDS Among People Ages 15-49: 0.3%
|
|
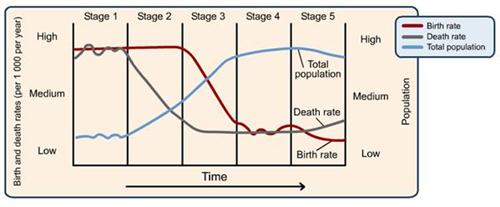
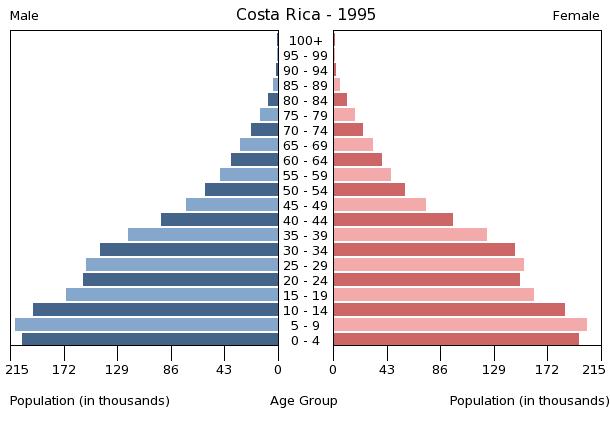
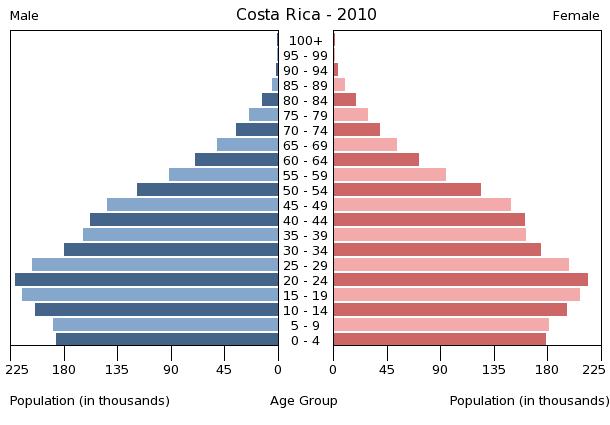
According to the data given on this page, I believe that Costa Rica is in stage three of the demographic transition model. Stage three of the DTM is when there is a decreasing birth rate and a continually falling death rate. In the data given above in the population pyramids you can see that in the 1995 pyramid the population is more spread out near the bottom of the graph while in the pyramid for 2010 the majority of the population is gravitating towards the middle of the graph. In the information given you can see that the birth rate is 16.08 while the death rate is 4.48, because of these numbers, Costa Rica cannot be in stage two because it does not have a high birth rate and it cannot be placed in stage four even though Costa Rica's population pyramid is starting to even out, there is still room for fluctuation in the graph in the areas of older people.
