Population (Mid-2014) : 23,201,926
• Density (people per sq. km) : 38
• Net Migration Rate (# per 1000 people) : 0
• Birth Rate (# per 1000 people) : 33.12
• Death Rate (# per 1000 people): 6.95
• Rate of Natural Increase : 2.7%
• Population Growth Rate : 2.62%
• Infant Mortality Rate (# of deaths per 1000 live births) : 44.88
• Total Fertility Rate (average # of children per woman) : 4.28
• Population Age <15 % : 42%
• Population Ages 65+ %: 3%
• Dependency Rate (add together Population Age <15 % and Ages 65+ %) : 45%
• Life Expectancy at Birth (total) : 65
• Life Expectancy at Birth Females : 66
• Life Expectancy at Birth Males : 63
• Primary School Completion Rate Females : 79%
• Primary School Completion Rate Males : 79%
• Secondary School Enrollment Net Females : 24%
• Secondary School Enrollment Net Males : 23%
• GNI PPP per capita in US$ : $1,350
• Economically Active Females 15+ : 84%
• Economically Active Males 15+ : 89%
• Mobile Phone Subscribers (# per 100) : 36.1
• Motor Vehicles (# per 1000) : n/a
• Undernourished Population:
• Underweight Children Under Age 5: 36.8
• HIV/AIDS Among People Ages 15-49: 0.3%
|
|
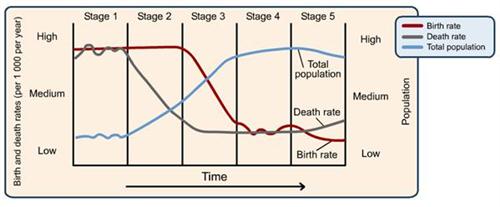
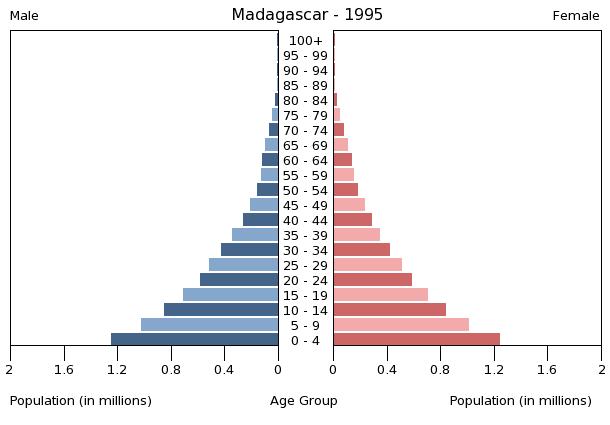
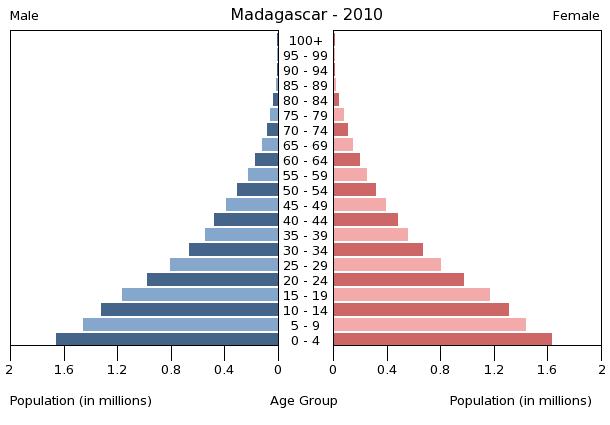
According to the data given on this page, I believe that Madagascar is in stage two of the demographic transition model. Stage two of the DTM is when there is high birth rates and falling death rates. In the data given above in the population pyramids you can see that the 2010 pyramid is taller than the pyramid for 1995 meaning that the life expectancy is increasing meang the death rate is also slowly decreasing. In the information given you can see that the birth rate is 33.12 while the death rate is 6.95, because of these numbers, Madagascar cannot be in stage one even though it has a high birth rate, it does not have a high death rate. Also, Madagascar cannot be put in stage three of the DTM because stage three indicates a falling death and birth rate, but looking at the population pyramids of 1995 and 2010 we can see that while the death rate has declined, the birth rate has actually increased.
